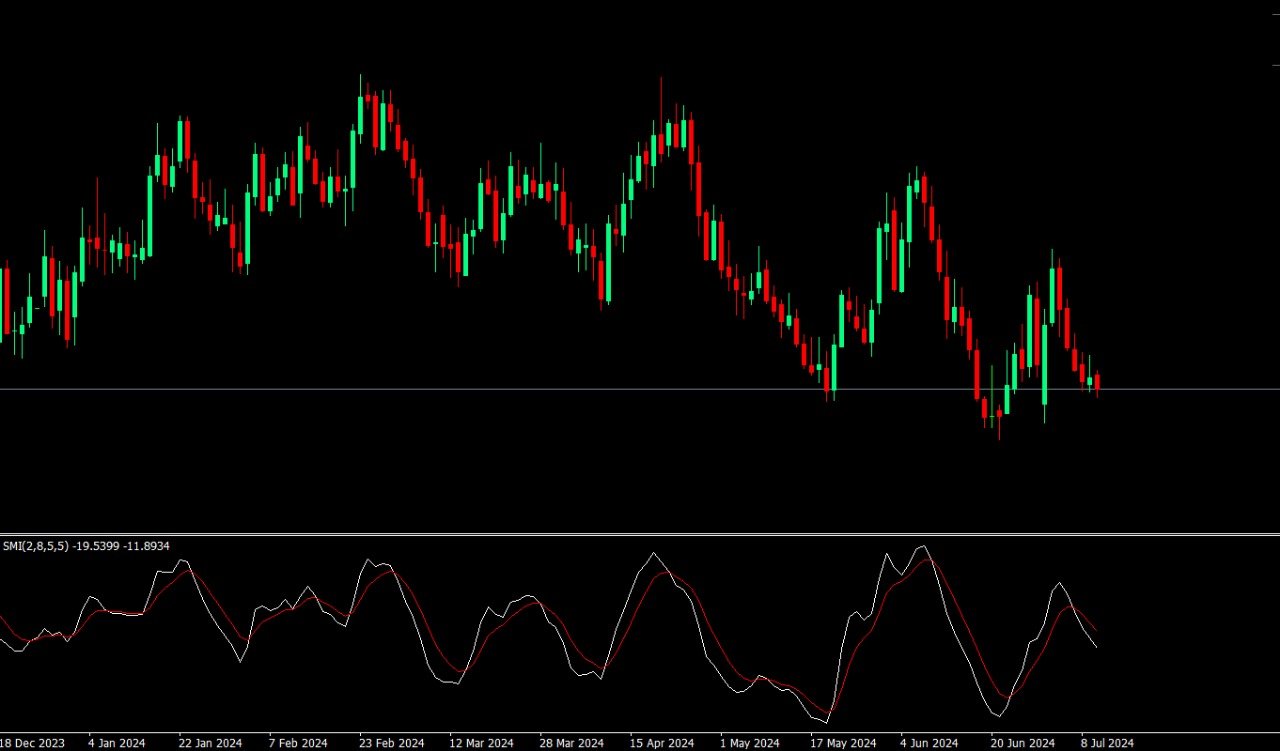
In the world of trading, momentum is key to making good decisions. The Stochastic Momentum Index (SMI) is a tool to help you identify the strength and direction of trends. An improvement on the traditional Stochastic Oscillator, the SMI gives a smoother and more accurate picture of price momentum.
This guide will take you through the history, calculations and practical application of the SMI so you can add this to your trading arsenal. Whether you are an experienced trader or just starting out, mastering the SMI will give you a big advantage in the markets.
Basics Explained
Before we get into the details, you need to understand the SMI. It’s a momentum indicator that shows the current close relative to the midpoint of the recent high-low range. It helps you see if the market is gaining or losing momentum. The SMI is a line that moves above and below a zero line, so it’s easy to read.
The SMI is meant to reduce the number of false signals that occur in volatile markets. Unlike the traditional Stochastic Oscillator which can be wild, the SMI is smoother and more stable. It’s good for traders who like a more refined and less noisy indicator.
How to Calculate the Stochastic Momentum Index
It’s not as hard as it sounds! Here’s a simplified version of the steps:
- High and Low: Find the highest high and lowest low over a 14 day period.
- Midpoint: Add the high and low together and divide by 2.
- Distance: Subtract the current close from the midpoint.
- Normalize: Scale this to a – 100 to + 100 range.
Most trading platforms will calculate the Stochastic Momentum Index for you, but knowing how it’s calculated helps you understand how it works and why it’s useful. The normalization is what makes the SMI give consistent and comparable results no matter the market or asset.
Interpreting Stochastic Momentum Index Values
You need to understand what the SMI values mean to use it. Positive values mean the price is above the midpoint of the high-low range, so upward momentum. Negative values mean the opposite, so downward momentum. The closer to +100 or -100 the stronger the momentum.
For example, an SMI of +80 means strong bullish momentum, price is way above the recent high-low range. An SMI of -80 means strong bearish momentum, price is way below the midpoint. These values help you gauge the strength of the trend and make better trading decisions.
Importance of Overbought and Oversold Conditions
One of the main uses of the SMI is to spot overbought and oversold conditions. When the SMI is above +40 the market might be overbought and you should sell. When it’s below -40 the market might be oversold and you should buy. These levels help you anticipate price reversals.
Knowing overbought and oversold conditions is key to timing your entries and exits in the market. An overbought market means buying pressure is exhausted and price might decline. An oversold market means selling pressure is waning and price might bounce. By using the SMI to spot these conditions you can manage your trades better and avoid getting caught in the wrong side of the market.

How to Use Stochastic Momentum Index
Using the SMI in your trading strategy can be very useful. It can help you decide when to enter or exit trades by spotting trends and momentum shifts. For example, if the SMI goes above zero it might be a buy. If it goes below zero it could be a sell.
Traders often use the SMI with other indicators to confirm signals and reduce false readings. For example, using the SMI with moving averages can help you determine the overall trend direction and add context to SMI signals. Using support and resistance levels with the SMI can also make it more effective by highlighting where momentum shifts are likely to happen.
Advantages and Challenges
The SMI has several advantages and challenges that traders should consider. On the plus side it gives clear signals and helps identify momentum shifts. The SMI’s smoother and more reliable readings compared to the traditional Stochastic Oscillator make it easier to read and act on. This is especially good in markets that are volatile, as the SMI will filter out a lot of the noise that other indicators will pick up.
But the SMI also has its downsides. It can give false signals, especially in choppy or sideways markets where price movement is less clear. This can lead to misinterpretation and poor trading decisions. And the SMI’s slower response time can be a problem in fast markets where quick decisions are key. In those situations, relying only on the SMI may not give you the timely insight to catch the fast price movement.
Use the SMI with other indicators and methods. Combining the best of all will confirm the signals and reduce false readings.
Stochastic Momentum Index vs. Other Indicators
Comparing to other indicators will help you understand what makes SMI unique. Unlike Stochastic Oscillator which can produce sudden and less stable signals, SMI is smoother and more reliable. But it’s slower to react to sudden price changes which can be a disadvantage in a fast market.
Compared to the Relative Strength Index (RSI) another popular momentum indicator, SMI gives a more detailed view of price momentum by looking at the midpoint of the high-low range. This can give more precise signals, especially in a market with frequent price fluctuations. But RSI is often preferred for its simplicity and ease of interpretation so it’s a good complement to SMI.
Merging SMI with Fundamental Analysis
While the Stochastic Momentum Index is a technical tool, combining it with fundamental analysis makes it even more powerful. Fundamental analysis looks at things like economic indicators, company earnings and news to predict price movements. Using the SMI to confirm those predictions allows you to make better trading decisions.
For example, if a company reports strong earnings and the price is supposed to go up, the SMI can confirm if the market momentum agrees with that. If the SMI is strong and bullish it confirms the fundamental analysis and you have more confidence in the trade. If the SMI is weak or bearish it may tell you to be cautious even if the fundamentals are positive.
Understanding Market Sentiment with SMI
The SMI can also give you insight into market sentiment. When the SMI is high all the time it means bullish sentiment, traders are optimistic about the market. When the SMI is low all the time it means bearish sentiment, and traders are pessimistic. Knowing this sentiment will help you gauge the overall market mood and make better trading decisions.
Market sentiment drives price action as it reflects the collective behavior and expectations of traders. By looking at the SMI along with other sentiment indicators like Fear and Greed Index you can get a full picture of market psychology. This will help you identify potential turning points and align your trades with the sentiment.
Stop Losses and Take Profits
The SMI can be used to set stop losses and take profits. By identifying where momentum is likely to change you can set better stop losses to protect your investments and take profits at the best levels. For example, if the SMI is overbought set a take profit at this level and lock in your gains before a reversal.
Conversely setting stop losses based on SMI can help you get out of trades when momentum weakens. For instance, if the SMI goes below zero it may mean momentum is shifting and you should close your positions to avoid further losses. Using the SMI like this can help with risk management and overall performance.
Final Words
In summary, the Stochastic Momentum Index is a great tool for traders to understand market momentum and make decisions. Learn how to calculate, interpret and apply the SMI and you will improve your trading strategy and chances of winning. Use it with other indicators and analysis for best results.
While the SMI gives you market momentum insights it’s important to know its limitations and use it with other tools and techniques. By combining technical and fundamental analysis, understanding market sentiment, and employing effective risk management strategies, you can unlock the full potential of the SMI and achieve greater success in your trading endeavours. Happy trading!
FAQS
What is the Stochastic Momentum Index (SMI)?
SMI is a trading tool to measure trend strength and direction. It shows the current close relative to the mid point of the recent high-low range.
How is SMI different from Stochastic Oscillator?
SMI is better than Stochastic Oscillator as it gives smoother and more accurate readings. It focuses on the mid point of the high-low range making it easier to read momentum shifts.
How can I use SMI to trade?
You can use SMI to identify trends and momentum shifts. For example if SMI crosses above zero it might be a buy signal. If it crosses below zero it could be a sell signal.
What are the pros and cons of SMI?
Pros: clear signals, can identify momentum shifts. Cons: false signals in choppy markets, slower in fast markets.
Can I use SMI with other tools?
Yes, SMI is used with other indicators and analysis to confirm signals and trade decisions. With moving averages and support/resistance levels it’s even better.